source
SubPlotter
def SubPlotter(
    width, height, title, plotsconfig:list=[['title', 'xlabel', 'ylabel', 1, 0, 111, ['line1']]], linewidth:int=2,
    legend_fontsize:int=8
):
Initialize self. See help(type(self)) for accurate signature.
source
run_hpct_animation
def run_hpct_animation(
    hpct, counter:NoneType=None, plotter:NoneType=None, interval:int=1, verbose:bool=False
):
Call self as a function.
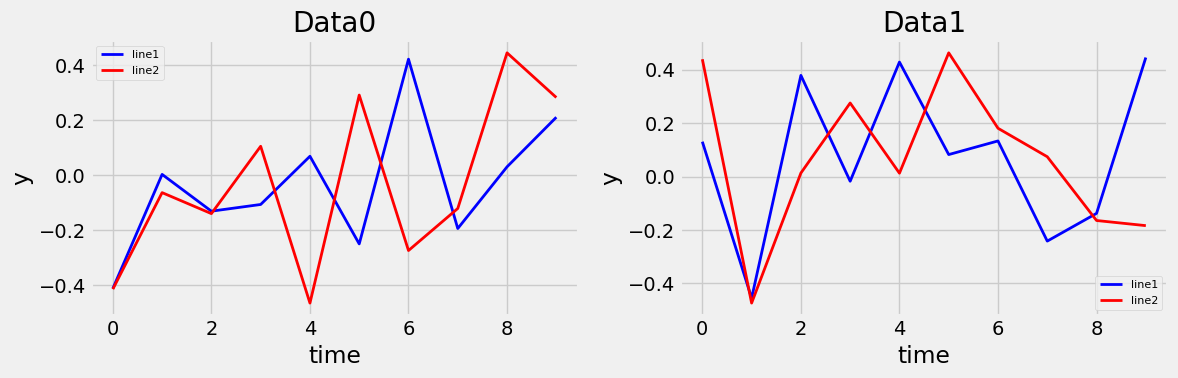
window = 20
plotter = SubPlotter(12, 4, "MyData", [["Data0", "time", "y", 2, window, 121, ['line1','line2']],
                                       ["Data1", "time", "y", 2, window, 122, ['line1','line2']]])

for x in  range(10):
    y11 = random()-0.5
    y12 = random()-0.5
    plotter.add_data(0, x, [y11, y12])
    y21 = random()-0.5
    y22 = random()-0.5
    plotter.add_data(1, x, [y21, y22])

plotter.draw()
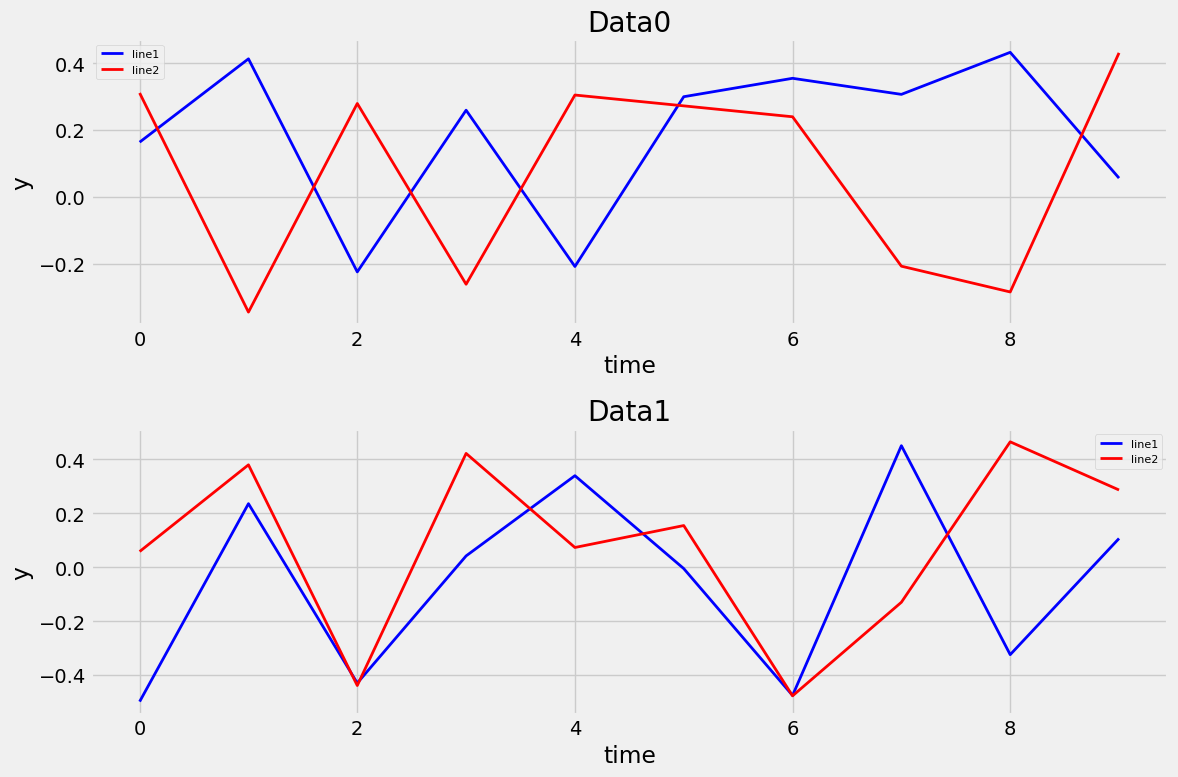
window = 20
plotter = SubPlotter(12, 8, "MyData", [["Data0", "time", "y", 2, window, 211, ['line1','line2']],
                                       ["Data1", "time", "y", 2, window, 212, ['line1','line2']]])

for x in  range(10):
    y11 = random()-0.5
    y12 = random()-0.5
    plotter.add_data(0, x, [y11, y12])
    y21 = random()-0.5
    y22 = random()-0.5
    plotter.add_data(1, x, [y21, y22])

plotter.draw()
window = 20
plotter = SubPlotter(12, 8, "MyData", [["Data0", "time", "y", 2, window, 221, ['line1','line2']],
                                       ["Data1", "time", "y", 2, window, 222, ['line1','line2']],
                                       ["Data2", "time", "y", 2, window, 212, ['line1','line2']]])

for x in  range(10):
    y11 = random()-0.5
    y12 = random()-0.5
    plotter.add_data(0, x, [y11, y12])
    y21 = random()-0.5
    y22 = random()-0.5
    plotter.add_data(1, x, [y21, y22])
    y21 = random()-0.5
    y22 = random()-0.5
    plotter.add_data(2, x, [y21, y22])

plotter.draw()